Analytics and reports
Review merchant performance totals, compare partner performance, and use engagement signals to decide what to improve next.
Before you start
- Have active partners, storefront traffic, or attributed orders to review.
Where to find it
Merchant sidebar → Analytics → Overview, Partner Leaderboard, Engagement Heatmap
Steps
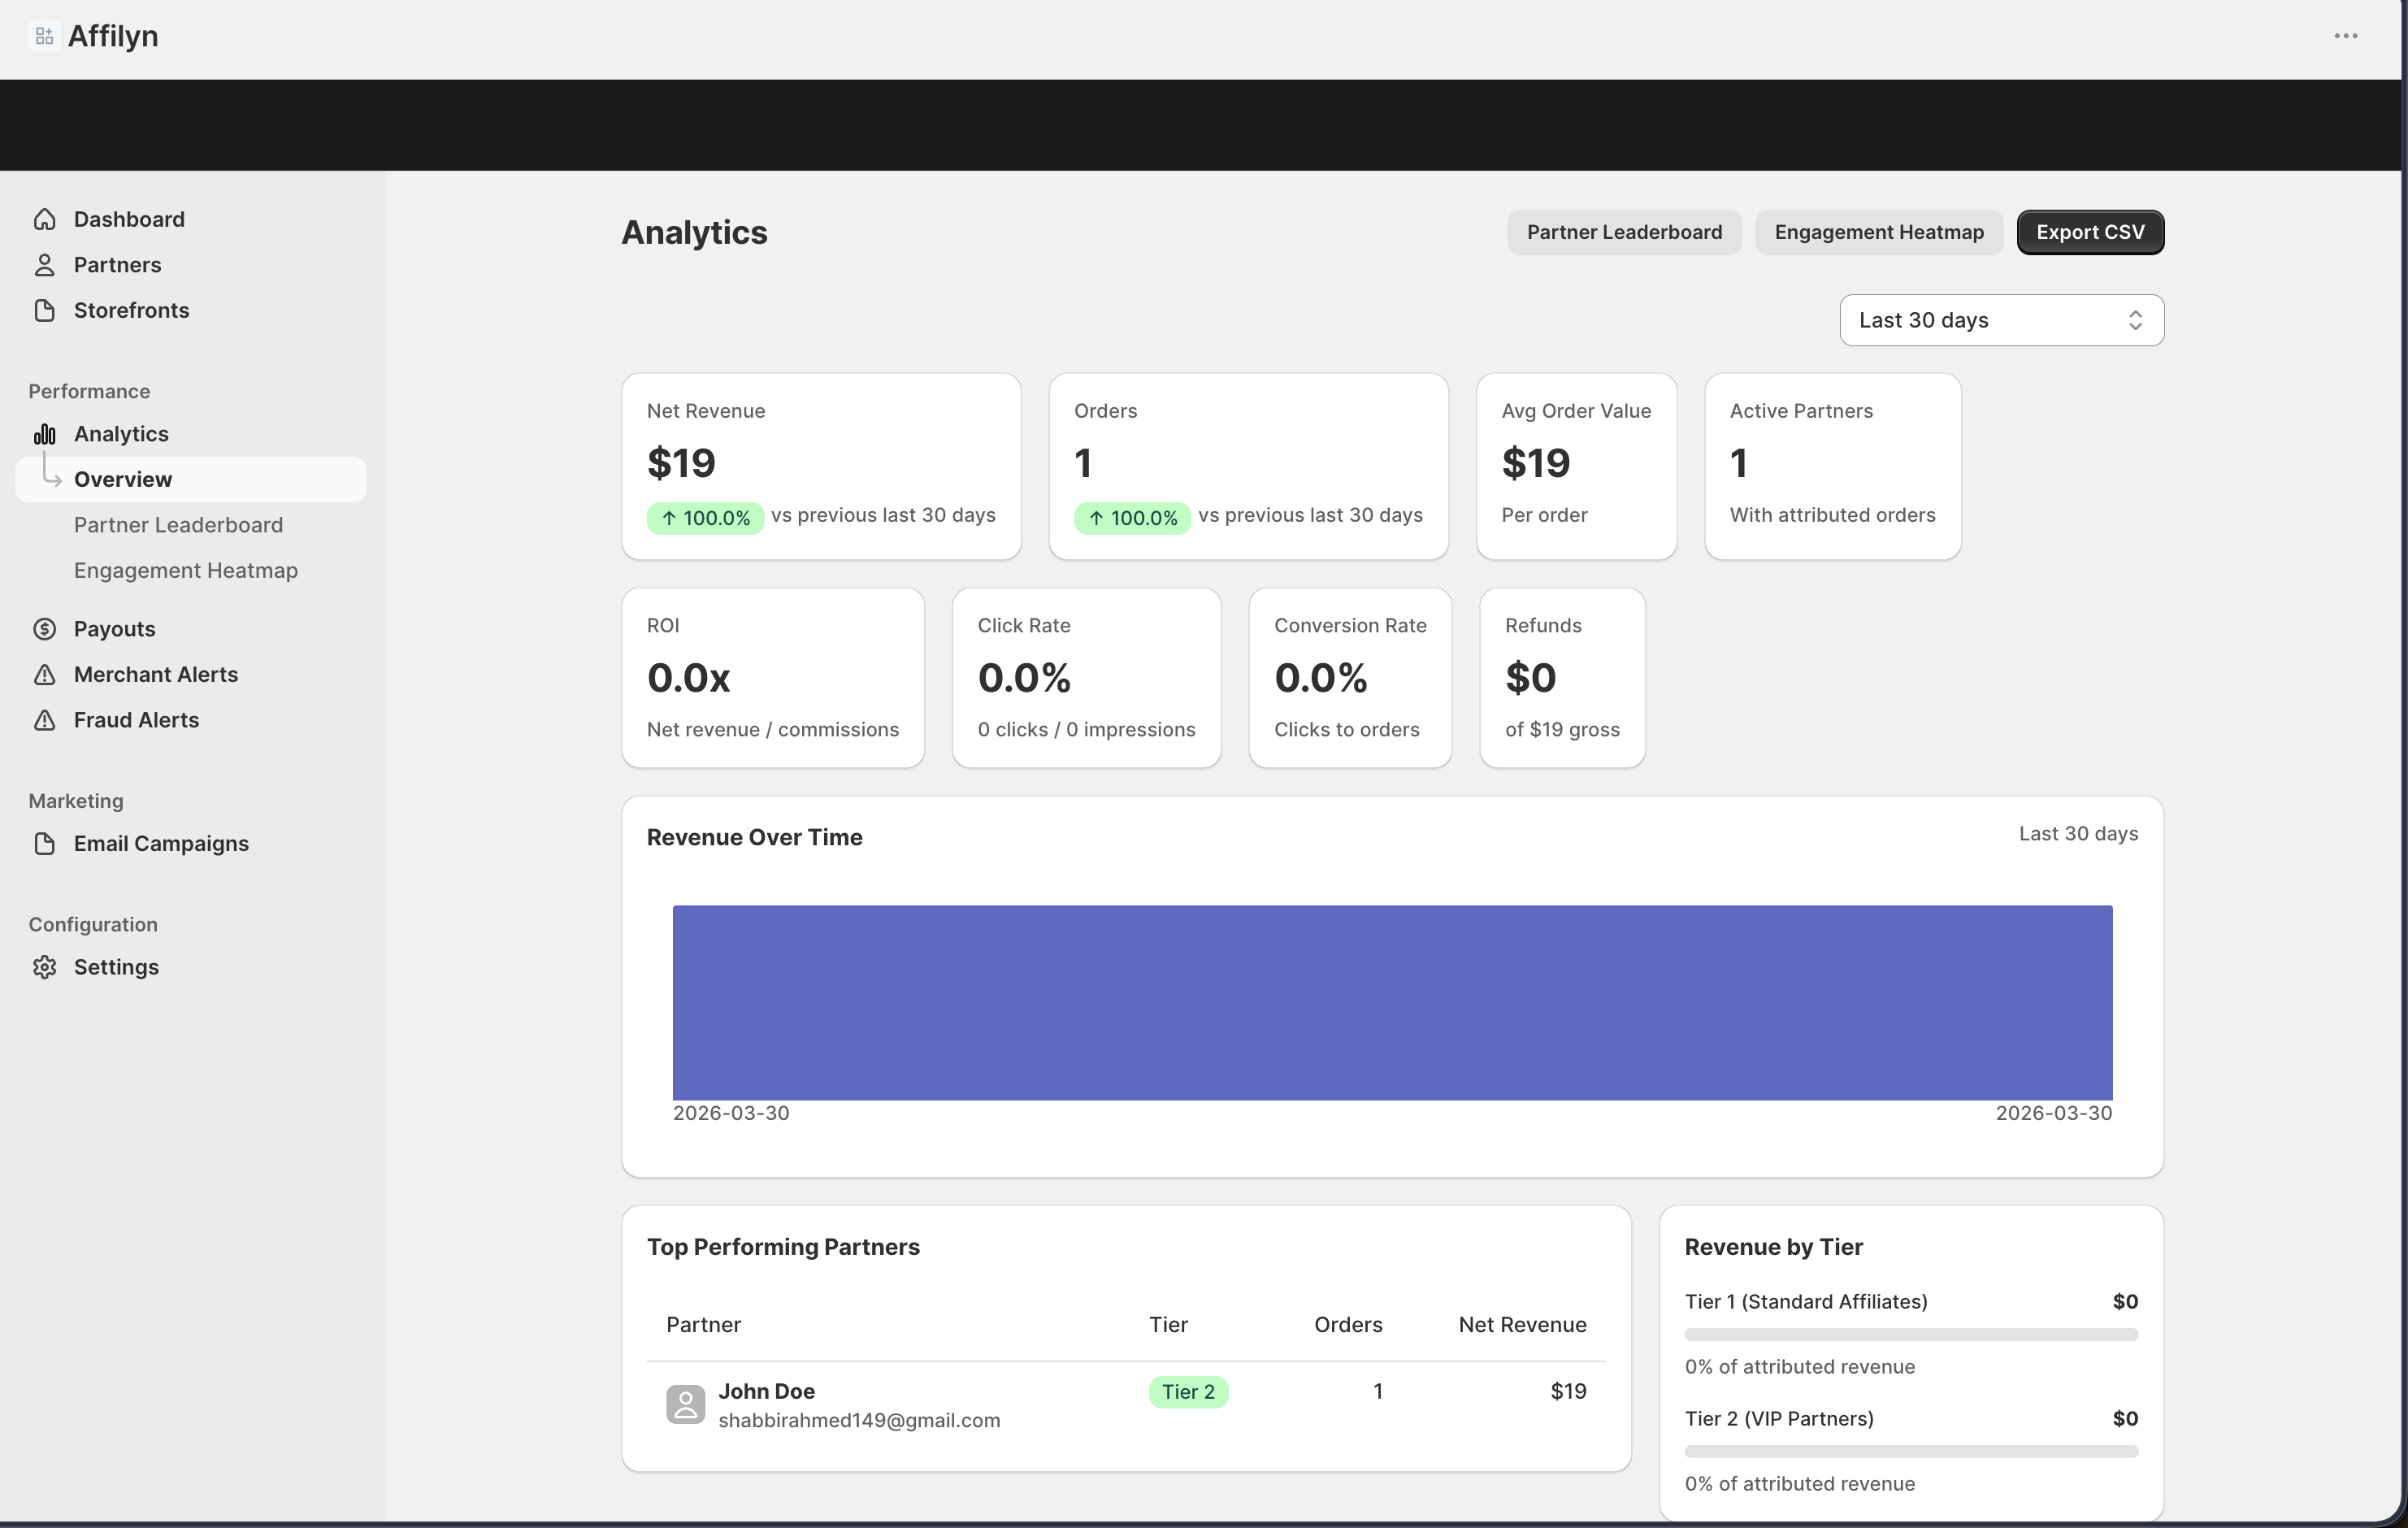
Step 1.
Open Analytics → Overview to review the current performance totals.
Step 2.
Export or record the main metrics when you need to share a summary with your team.
Step 3.
Open Partner Leaderboard to compare partners across the selected period.
Step 4.
Open Engagement Heatmap to see where shopper attention is strong or weak.
Step 5.
Use what you learn to decide whether the next action belongs in storefronts, partner management, or campaigns.
Settings explained
- Overview is best for quick program totals.
- Partner Leaderboard helps you compare who is performing best in the selected time period.
- Engagement Heatmap highlights stronger and weaker shopper interest patterns.
- Export is useful when you need a clean snapshot outside the dashboard.
Example
A merchant sees good traffic but weaker conversion in the overview, checks the leaderboard to find the most effective partners, then uses the heatmap to identify product areas that need better storefront placement or stronger campaign support.
Tips and limits
- Review the overview before making decisions from one report alone.
- Compare leaderboard results with storefront quality before changing tier or commission rules.
- Heatmap signals are most useful when there is enough shopper activity to compare.